Just as statistics or graphs can distort reality, so can the maps we use every day. However, if you learn the mathematics hidden behind maps, you will not be so easily led astray, says mathematician Dr. Paulina Rowińska.
A graduate of Imperial College London, Dr. Rowińska is a promoter of mathematics. Her new book Mapmatics: How We Navigate the World Through Numbers analyses various maps and describes interesting related mathematical issues.
'There is a growing awareness that statistics and infographics we come across can be deceptive. But so can maps! And, after all, we make various decisions based on them. It is worth remembering this!’, Dr. Rowińska tells PAP.
The weather forecast on TV, choosing a vacation trip route, applications showing where your parcel is, maps illustrating world events, and even 'geographic' memes like 'the most popular names in various countries'. 'There is not a day when you do not use maps. These are usually maps that we have not created ourselves, someone else has. Should you trust them completely? If you find out, even a simplified version, what mathematics is behind individual maps, it will be harder to deceive you', Rowińska says. In her book, she explains, among other things, why - and how - various maps trick us.
MAP TRICKS
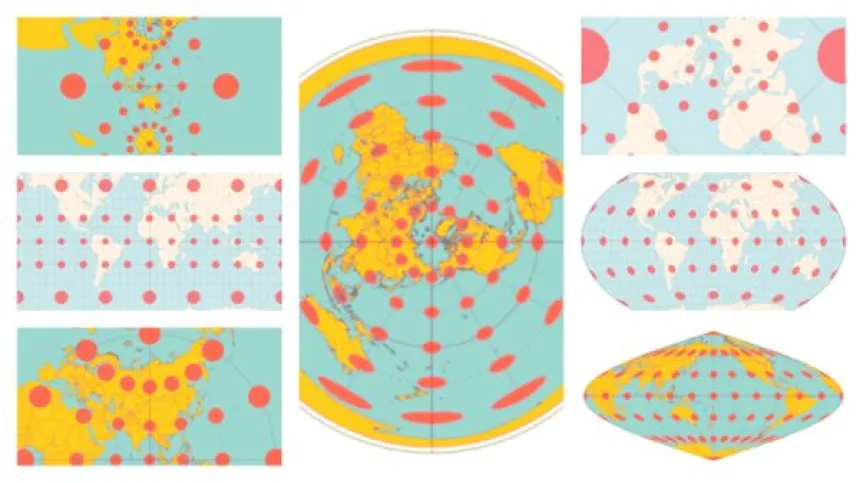
When creating maps of the world, one of the insurmountable problems is that we are not able not able to reproduce a three-dimensional sphere - the surface of a ball - without distortions on a two-dimensional sheet of paper. 'The easiest way to see this is when you peel an orange - you cannot lay the peel flat on the table. To do this, you have to tear it in many places' Rowińska says citing Carl Friedrich Gauss in his 'Remarkable Theorem' (Theorema Egregium). Therefore, there will always be some distortions in world maps - in angles, distances, areas, because you have to find some way that bends reality to project the sphere (or rather geoid) onto a sheet of paper.
Dr. Rowińska gives an example of the commonly used Mercator map. 'It was created for navigation and it is really good for that: the angles are preserved in it. However, it is not suitable for learning about the world in school, because, for example, the proportions of the surfaces of the continents are distorted', she says.
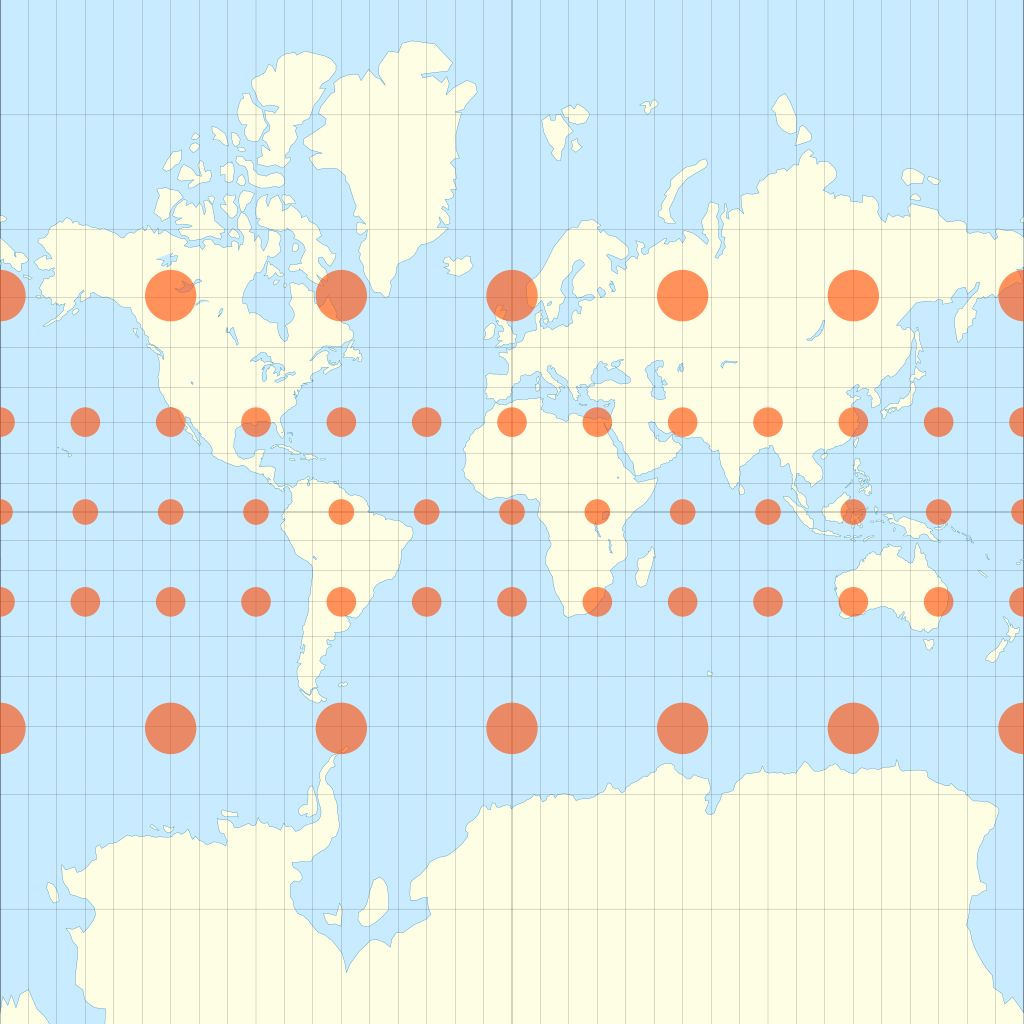
On the Mercator projection (a conformal cylindrical map), circles of latitude and meridians of longitude are perpendicular to each other in every place on the map. And north is always at the top. The cost of such a representation of the sphere is that the surfaces are distorted: Antarctica, Russia and Greenland, located closer to the poles, seem gigantic, while Africa and South America, located closer to the equator - disproportionately small.
In her book, Rowińska suggests solving a quiz to see how difficult it is to compare the surfaces of different areas, especially if you more often deal with tricky maps than with an ordinary globe.
When asked which projections are better than Mercator for familiarizing oneself with the world, she suggests, for example, the Gall-Peters equal-area map projection, which also distorts the shapes of the continents, but reflects their surface well.
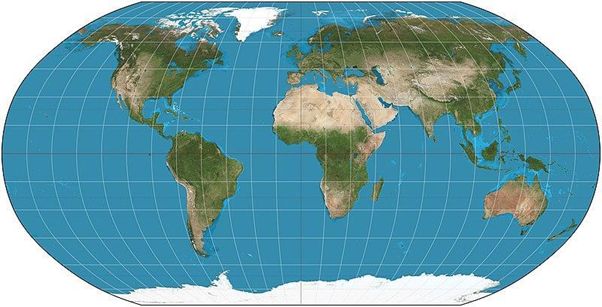
The researcher also recommends the Winkel tripel projection and the Robinson projection, which distort the surface, direction, and distance a little, but overall still give a good idea of the world's layout. 'The Robinson projection is, in my opinion, one of the most beautiful', she says.
AIRPLANE TRICKS
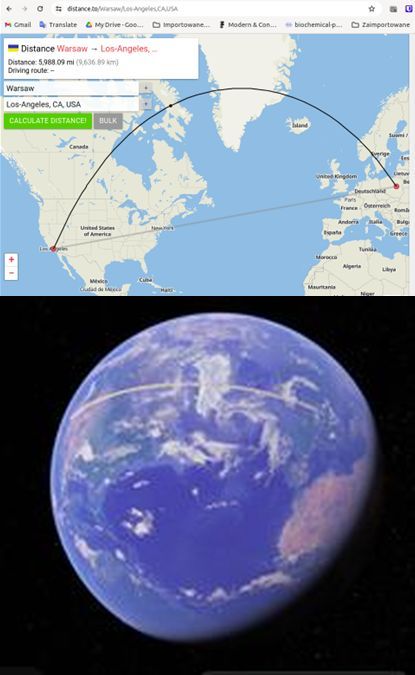
In her book, Rowińska also draws attention to how strange the long distances airplane routes look on flat maps. Why does a plane flying from Warsaw to Los Angeles, located to the south of Warsaw, fly over Sweden, Norway, Greenland and Canada? When you look at this route on the Mercator map, it seems like an unnecessary detour: would it not be easier to fly over Germany and France? However, you have to remember that the shortest route on a flat map does not have to be the shortest route on a sphere. Just stretch a string on a globe (or a ruler, for example, in the Google Earth application, which shows the Earth's sphericity at longer distances) to see that a flat map can be really misleading.
PUBLIC TRANSPORT TRICKS
A bit of mathematics will also come in handy in better understanding how public transport maps can trick us.
Henry Beck's London Underground map has already become iconic. The underground lines run only vertically, horizontally, and at a 45-degree angle, and all stations on a line are equally spaced. The Warsaw rail transport map is similarly constructed.
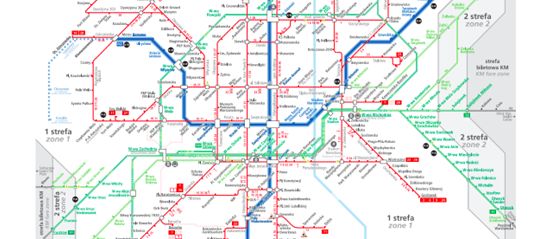
Such a map is indeed clear if you want to get somewhere but don't care about time: it preserves the order of stops and transfer options. However, the distances between points in the city, the angles at which lines intersect, and the sizes of districts are seriously distorted.
This is where the branch of mathematics called topology comes into play - a science in which squeezing, kneading or stretching (without tearing and gluing) does not change the properties of objects. 'Such deformations, called homeomorphisms (from the Greek homoios meaning +similar, equal+ and morphē meaning +shape+), preserve the connections between points. If two points were close to each other before, they will still be relatively close to each other after the homeomorphism', Rowińska says. She adds that this is precisely what makes Beck's map unique. In this type of map, 'topology, not topography, is important'.
MAPS IN POLITICS
Maps not only trick you, they can be used by others to trick you - on a large scale - for example, to win elections.
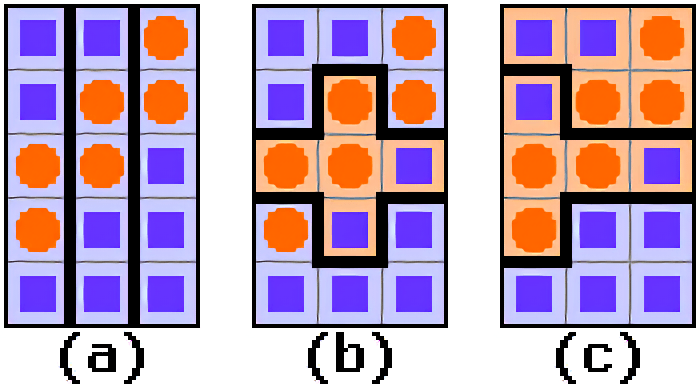
Gerrymandering is a technique of setting the boundaries of electoral districts in such a way that candidates of a certain party can win, obtain the largest possible number of electoral mandates. If you know the preferences of voters in different areas, you can, for example, set the boundaries of electoral districts in such a way as to +stuff+ opponents in the smallest possible number of electoral districts, and, consequently, ensure your victory in the remaining electoral districts. Another trick is to expand the boundaries so that opponents become the minority. According to Rowińska, all these tactics aim to waste the votes of opponents as much as possible, and thus prevent competitors from influencing elections. And this is against the principle of democracy, according to which every vote counts equally.
She adds that many groups of mathematicians are working in the US to refine algorithms to draw districts fairly.
'It is best to form your own opinion about different maps, learn their advantages and drawbacks, and find out what they result from', says Dr. Rowińska.
The consequences of uncritical use of maps can be trivial - someone will not get to the place they are looking for on time, or make a detour during a trip. But there are serious ones as well: a dishonest party will win the election. Or a missile during an armed conflict is sent to the wrong place, which will change the course of the war.
PAP - Science in Poland, Ludwika Tomala
lt/ agt/ kap/
tr. RL


